Jupyter Book
Introduction
About This Book
About the Datasets
About the Interactive Book
1. Overview
1.1 LLC90 Model
1.2 CS510 Model
1.3 LLC4320 Model
2. LLC90 Plotting Examples
2.1 Data Query
2.2 Regional Map
2.3 Histogram
2.4 Sectional Map
2.5 Time Series
2.6 XY plot
3. CS510 Plotting Examples
3.1 Data Query
3.2 Regional Map
3.3 Histogram
3.4 Sectional Map
3.5 Time Series
3.6 XY plot
4. LLC4320 Plotting Examples
4.1 Data Query
4.2 Regional Map
4.3 Histogram
4.4 Sectional Map
4.5 Time Series
4.6 XY plot
5. Demo Applications
5.1 Ecosystem Clustering Example
5.2 Standard Plots
6. Features
6.1 Markdown
6.2 Notebooks
6.3 Depth
Toggle Sidebar
LLC90 Plotting Examples
Data Query
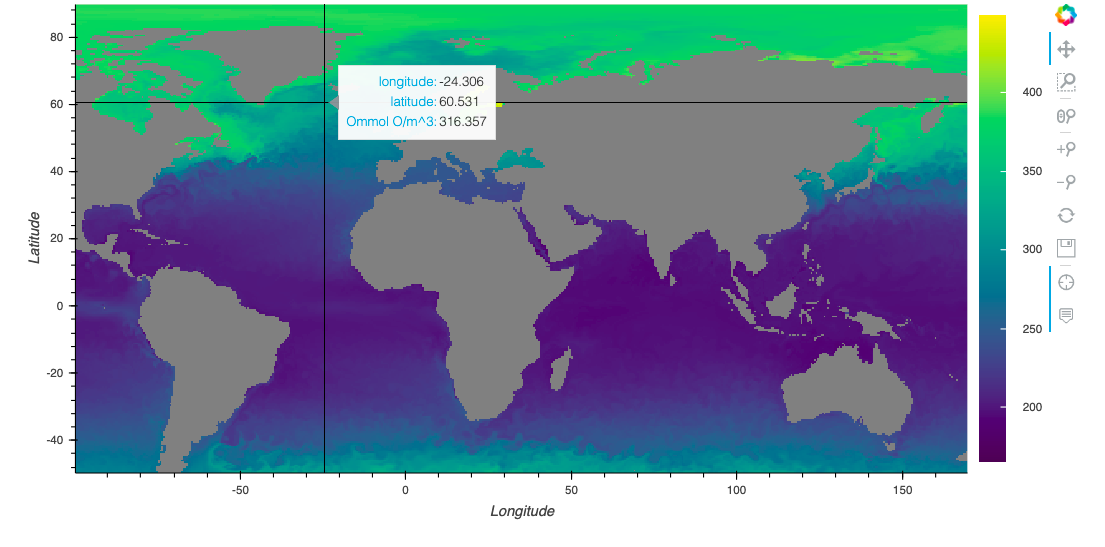
Regional Map
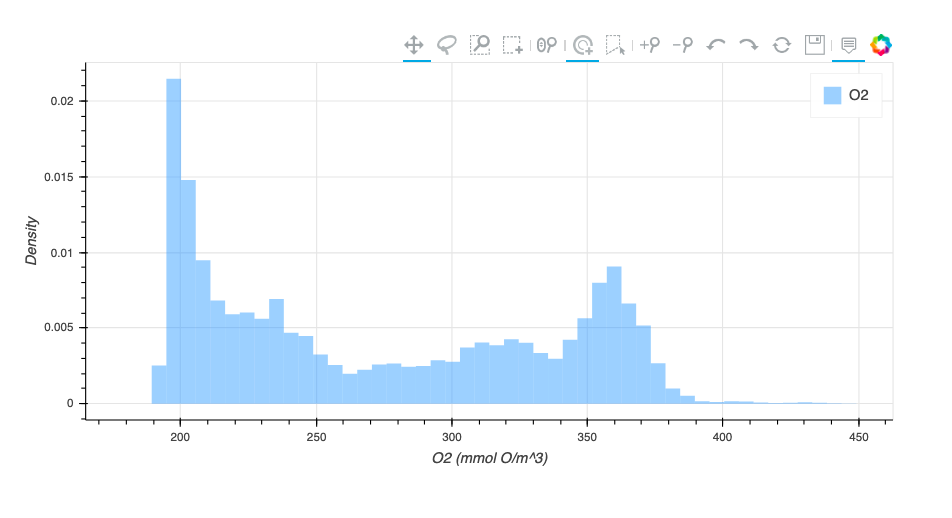
Histogram
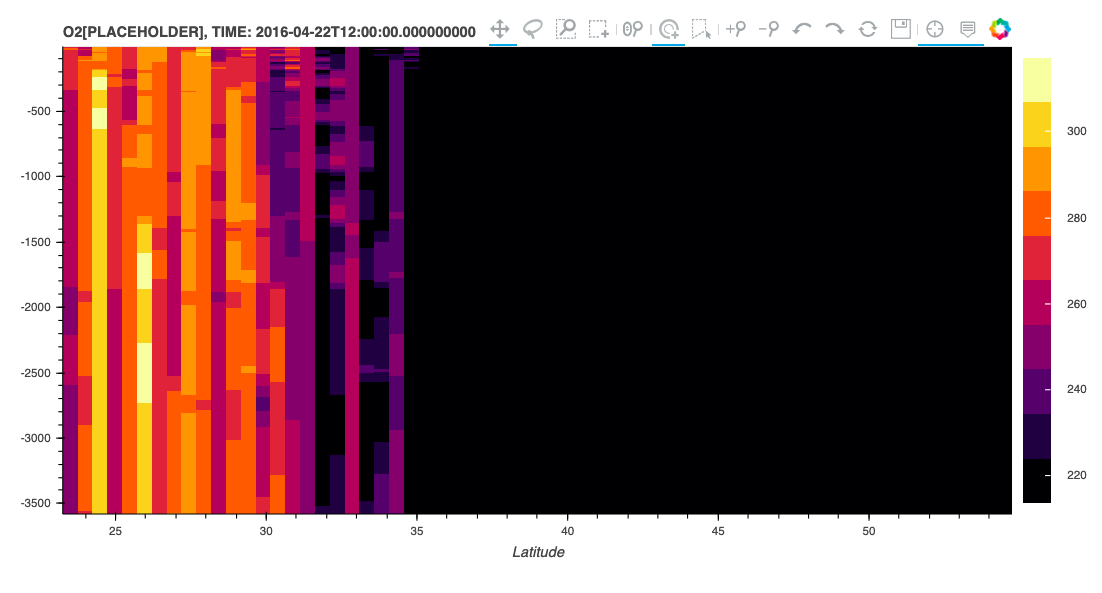
Sectional Map
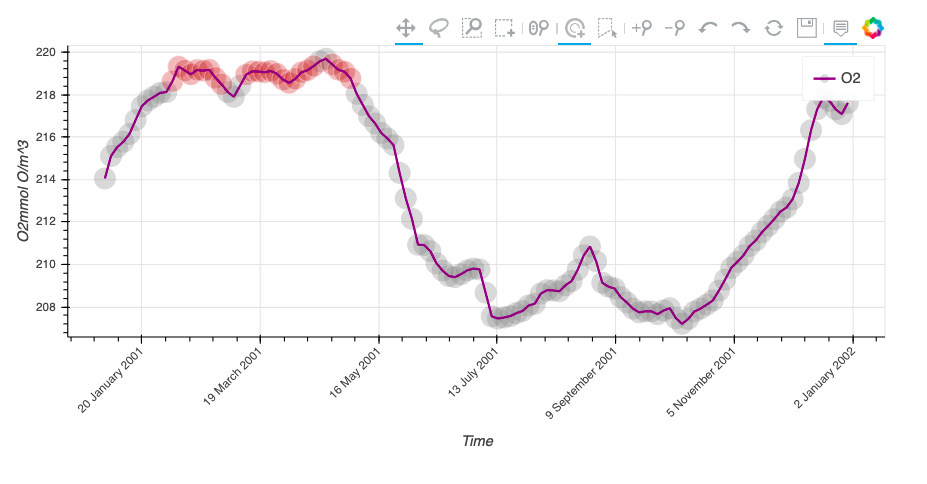
Time Series
〈
LLC4320 Model
Data Query
〉