Sectional Map Method

Reformat NetCDF4 File for Function Call

import sys
!{sys.executable} -m pip install netCDF4
!{sys.executable} -m pip install xarray
import opedia
import netCDF4
import os
import numpy as np
import pandas as pd
import xarray as xr
import datetime as dt
from scipy.interpolate import griddata
import db
import subset
import common as com
import climatology as clim
from bokeh.io import output_notebook
from datetime import datetime, timedelta
import time
from bokeh.plotting import figure, show, output_file
from bokeh.layouts import column
from bokeh.palettes import all_palettes
from bokeh.models import HoverTool, LinearColorMapper, BasicTicker, ColorBar
from bokeh.embed import components
import jupyterInline as jup
if jup.jupytered():
    from tqdm import tqdm_notebook as tqdm
else:
    from tqdm import tqdm

NetCDF Compatible Function

def xarraySectionMap(tables, variabels, dt1, dt2, lat1, lat2, lon1, lon2, depth1, depth2, fname, exportDataFlag):
    data, lats, lons, subs, frameVars, units = [], [], [], [], [], []
    xs, ys, zs = [], [], []
    for i in tqdm(range(len(tables)), desc='overall'):
        
        toDateTime = tables[i].indexes['TIME'].to_datetimeindex()
        tables[i]['TIME'] = toDateTime
        table = tables[i].sel(TIME = slice(dt1, dt2), LAT_C = slice(lat1, lat2), LON_C = slice(lon1, lon2), DEP_C = slice(depth1, depth2))
        ############### export retrieved data ###############
        if exportDataFlag:      # export data
            dirPath = 'data/'
            if not os.path.exists(dirPath):
                os.makedirs(dirPath)                
            exportData(df, path=dirPath + fname + '_' + tables[i] + '_' + variabels[i] + '.csv')
        #####################################################

        times = np.unique(table.variables['TIME'].values)
        lats = np.unique(table.variables['LAT_C'].values)
        lons = np.unique(table.variables['LON_C'].values)
        depths = np.flip(np.unique(table.variables['DEP_C'].values))
        shape = (len(lats), len(lons), len(depths))
        
        hours = [None]

        unit = '[PLACEHOLDER]'

        for t in times:
            for h in hours:
                frame = table.sel(TIME = t, method = 'nearest')
                sub = variabels[i] + unit + ', TIME: ' + str(t) 
                if h != None:
                    frame = frame[frame['hour'] == h]
                    sub = sub + ', hour: ' + str(h) + 'hr'
                try:    
                    shot = frame[variabels[i]].values.reshape(shape)
                    shot[shot < 0] = float('NaN')
                except Exception as e:
                    continue    
                data.append(shot)
                
                xs.append(lons)
                ys.append(lats)
                zs.append(depths)

                frameVars.append(variabels[i])
                units.append(unit)
                subs.append(sub)
    
    bokehSec(data=data, subject=subs, fname=fname, ys=ys, xs=xs, zs=zs, units=units, variabels=frameVars)
    return

Helper Functions

BokehSec Function

def bokehSec(data, subject, fname, ys, xs, zs, units, variabels):
    TOOLS="crosshair,pan,wheel_zoom,zoom_in,zoom_out,box_zoom,undo,redo,reset,tap,save,box_select,poly_select,lasso_select,"
    w = 1000
    h = 500
    p = []
    data_org = list(data)
    for ind in range(len(data_org)):
        data = data_org[ind]
        lon = xs[ind]
        lat = ys[ind]
        depth = zs[ind]      
        
        bounds = (None, None)
        paletteName = com.getPalette(variabels[ind], 10)
        low, high = bounds[0], bounds[1]
        
        if low == None:
            low, high = np.nanmin(data[ind].flatten()), np.nanmax(data[ind].flatten())
        color_mapper = LinearColorMapper(palette=paletteName, low=low, high=high)
        output_notebook()
        if len(lon) > len(lat):
            p1 = figure(tools=TOOLS, toolbar_location="above", title=subject[ind], plot_width=w, plot_height=h, x_range=(np.min(lon), np.max(lon)), y_range=(-np.max(depth), -np.min(depth)))
            data = np.nanmean(data, axis=0)
            data = np.transpose(data)
            data = np.squeeze(data)
            xLabel = 'Longitude'
            data = regulate(lat, lon, depth, data)
            p1.image(image=[data], color_mapper=color_mapper, x=np.min(lon), y=-np.max(depth), dw=np.max(lon)-np.min(lon), dh=np.max(depth)-np.min(depth))
        else:
            p1 = figure(tools=TOOLS, toolbar_location="above", title=subject[ind], plot_width=w, plot_height=h, x_range=(np.min(lat), np.max(lat)), y_range=(-np.max(depth), -np.min(depth)))
            data = np.nanmean(data, axis=1)
            data = np.transpose(data)
            data = np.squeeze(data)
            xLabel = 'Latitude'      
            data = regulate(lat, lon, depth, data)
            p1.image(image=[data], color_mapper=color_mapper, x=np.min(lat), y=-np.max(depth), dw=np.max(lat)-np.min(lat), dh=np.max(depth)-np.min(depth))

        p1.xaxis.axis_label = xLabel
        p1.add_tools(HoverTool(
            tooltips=[
                (xLabel.lower(), '$x'),
                ('depth', '$y'),
                (variabels[ind]+units[ind], '@image'),
            ],
            mode='mouse'
        ))

        p1.yaxis.axis_label = 'depth [m]'
        color_bar = ColorBar(color_mapper=color_mapper, ticker=BasicTicker(),
                        label_standoff=12, border_line_color=None, location=(0,0))
        p1.add_layout(color_bar, 'right')
        p.append(p1)
    dirPath = 'embed/'
   # if not os.path.exists(dirPath):
   #     os.makedirs(dirPath)        
   # if not inline:      ## if jupyter is not the caller
   # output_file(dirPath + fname + ".html", title="Section Map")
    show(column(p))
    return

Regulate Function

def regulate(lat, lon, depth, data):
    depth = -1* depth 
    deltaZ = np.min( np.abs( depth - np.roll(depth, -1) ) )
    newDepth =  np.arange(np.min(depth), np.max(depth), deltaZ)        

    if len(lon) > len(lat):
        lon1, depth1 = np.meshgrid(lon, depth)
        lon2, depth2 = np.meshgrid(lon, newDepth)
        lon1 = lon1.ravel()
        lon1 = list(lon1[lon1 != np.isnan])
        depth1 = depth1.ravel()
        depth1 = list(depth1[depth1 != np.isnan])
        data = data.ravel()
        data = list(data[data != np.isnan])
        data = griddata((lon1, depth1), data, (lon2, depth2), method='linear')
    else:   
        lat1, depth1 = np.meshgrid(lat, depth)
        lat2, depth2 = np.meshgrid(lat, newDepth)
        lat1 = lat1.ravel()
        lat1 = list(lat1[lat1 != np.isnan])
        depth1 = depth1.ravel()
        depth1 = list(depth1[depth1 != np.isnan])
        data = data.ravel()
        data = list(data[data != np.isnan])
        data = griddata((lat1, depth1), data, (lat2, depth2), method='linear')

    depth = -1* depth 
    return data

Testing Space

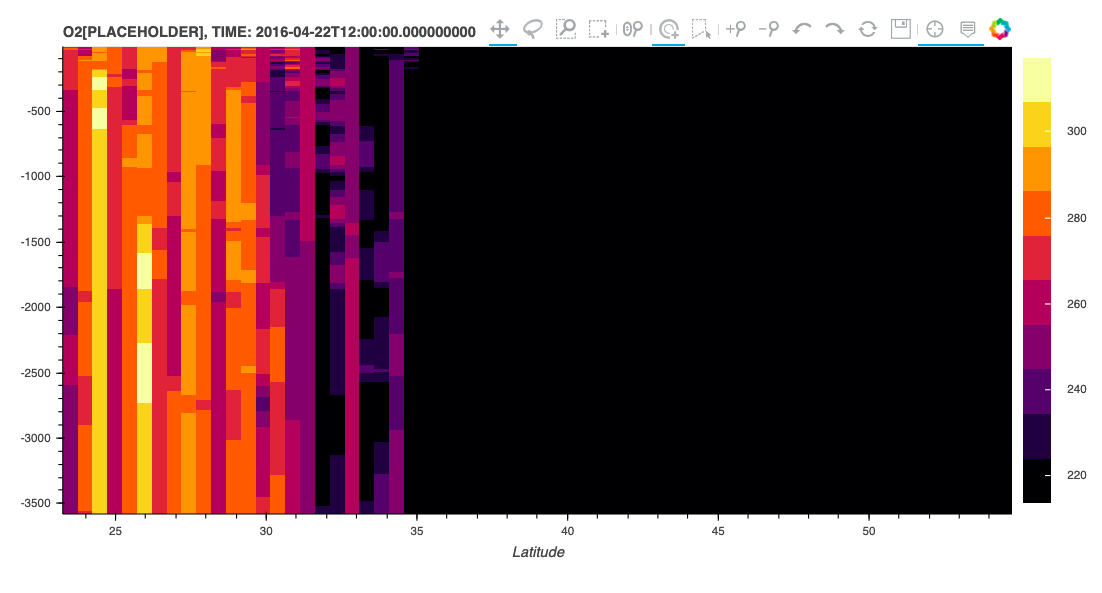
#TESTS NETCDF-COMPATIBLE FUNCTION
xFile = xr.open_dataset('http://3.88.71.225:80/thredds/dodsC/las/id-a1d60eba44/data_usr_local_tomcat_content_cbiomes_20190510_20_darwin_v0.2_cs510_darwin_v0.2_cs510_nutrients.nc.jnl')

tables = [xFile]    # see catalog.csv  for the complete list of tables and variable names
variabels = ['O2']                            # see catalog.csv  for the complete list of tables and variable name
dt1 = '2016-04-22'   # PISCES is a weekly model, and here we are using monthly climatology of Darwin model
dt2 = '2016-04-22'
lat1, lat2 = 23, 55
lon1, lon2 = -159, -157
depth1, depth2 = 0, 3597
fname = 'sectional'
exportDataFlag = False       # True if you you want to download data

xarraySectionMap(tables, variabels, dt1, dt2, lat1, lat2, lon1, lon2, depth1, depth2, fname, exportDataFlag)