Regional Map Method
NetCDF4 file(s) to read from:
xFile = xr.open_dataset('http://3.88.71.225:80/thredds/dodsC/las/id-a1d60eba44/data_usr_local_tomcat_content_cbiomes_20190510_20_darwin_v0.2_cs510_darwin_v0.2_cs510_nutrients.nc.jnl')
Parameters (CDF4 tables, variables (with respect to table), time/longitude/latitude/depth constraints):
tables = [xFile]
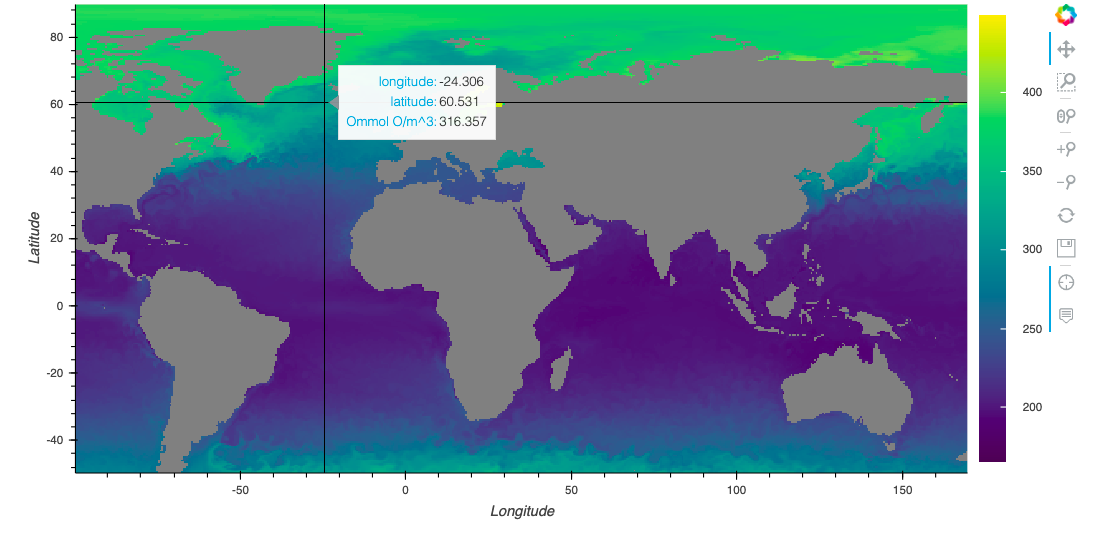
variables = ['O2']
startDate = '2016-04-30'
endDate = '2017-04-30'
lat1, lat2 = -50, 90
lon1, lon2 = -100, 170
depth1, depth2 = 0, 50
fname = 'regional'
exportDataFlag = False
Regional Map Function (w/ respective parameters) :
Bokeh Map Function (w/ respective parameters) :
Testing Space
regionalMap(tables, variables, startDate, endDate, lat1, lat2, lon1, lon2, depth1, depth2, fname, exportDataFlag)